How Visual Dashboards Help You Analyze Office Metrics
Visual dashboards offer a modern and effective way to analyze and optimize office metrics. Here's how to reap their benefits.
Updated March 27, 2023.
Office metrics, such as occupancy and space utilization, are key indicators of your organization's performance, employee productivity, and efficiency. While these metrics have traditionally been assessed through employee surveys or manual spreadsheets, conducting these methods can be tedious and error-prone.
However, with the emergence of visual dashboards, you can analyze office metrics in a much more powerful and effective way.
Let Visual Dashboards Take The Lead
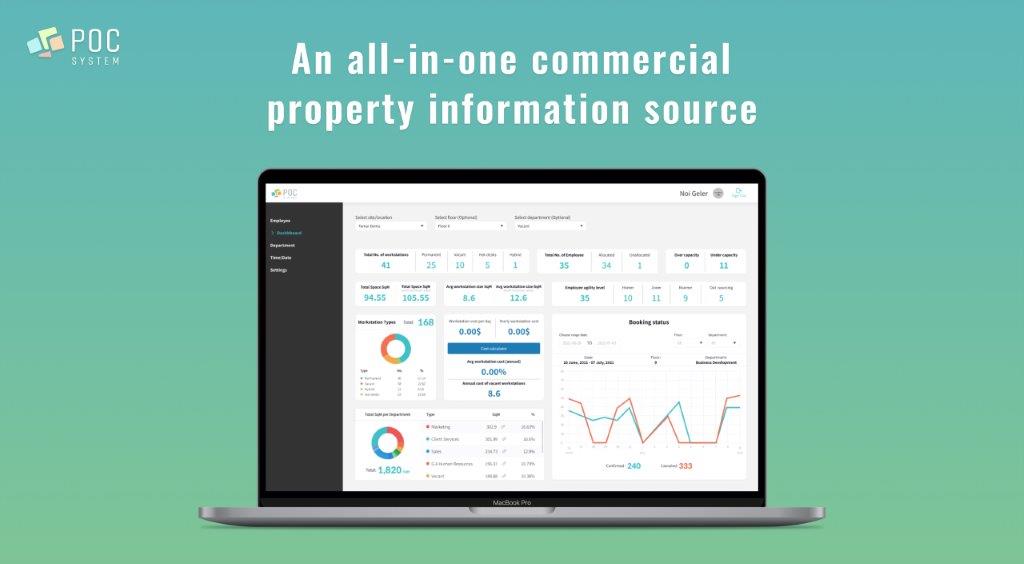
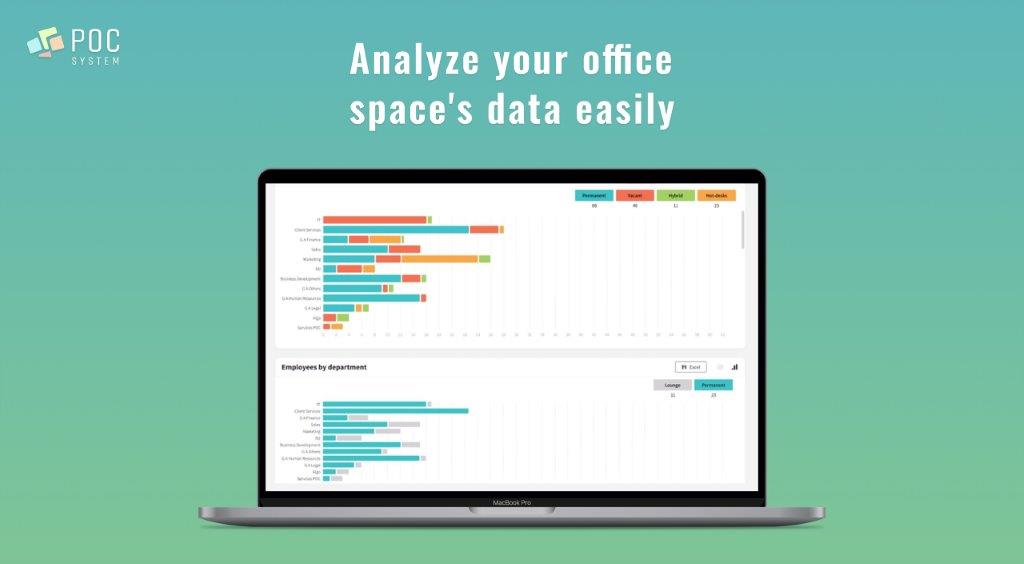
Visual dashboards are tools that present data with detailed charts, graphs, and maps, allowing you to measure office metrics more easily.
These solutions can simplify your operations and boost your productivity because they're:
- Time-saving: As automated solutions designed to easily ingest your existing data, visual dashboards are quick to set up, allowing you to track your space usage and desk occupancy in real-time right away.
- Easy to understand: By showcasing multiple visual elements, such as charts, graphs, maps, and widgets, visual dashboards can give you a general overview of areas that need optimization and are running smoothly. Additionally, when you implement new workplace practices, visual dashboards can track the results and help you gauge how they're working out.
- Customizable: The customizability of visual dashboards means you can tailor the visualizations to meet your business needs. This, in turn, gives you the option to simplify the information for more detailed analyses and see potential discrepancies.
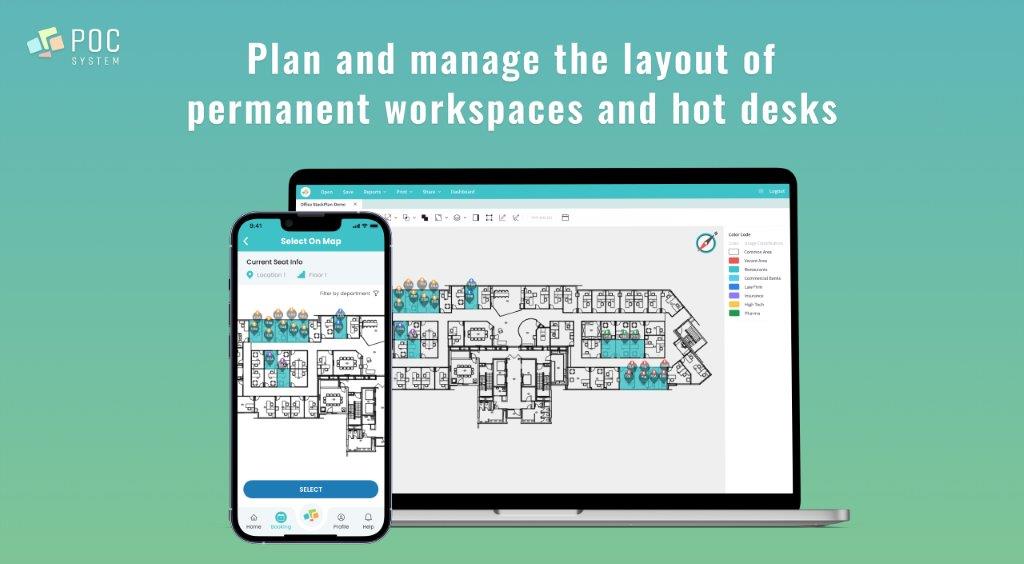
- Helpful for optimizing office space: Visual dashboards can provide accurate information on your space utilization at all times. This lets you experiment with different floor plans and see their impact, allowing you to decide which office layout and office seating allocation to settle on.
■ Optimize your office space usage with key space utilization metrics
Visualize Your Office Metrics
Visual dashboards offer a great way to streamline your workflows by allowing you to analyze different office metrics simultaneously and use the data to rearrange your office space. However, not all visual dashboard solutions are equally effective, which is why it's important to choose the right one for your business.


- Custom seating plans for maximum employee productivity
- Real-time tracking of current seating and office layout
- Advanced insights into analytics to tailor your space according to your needs
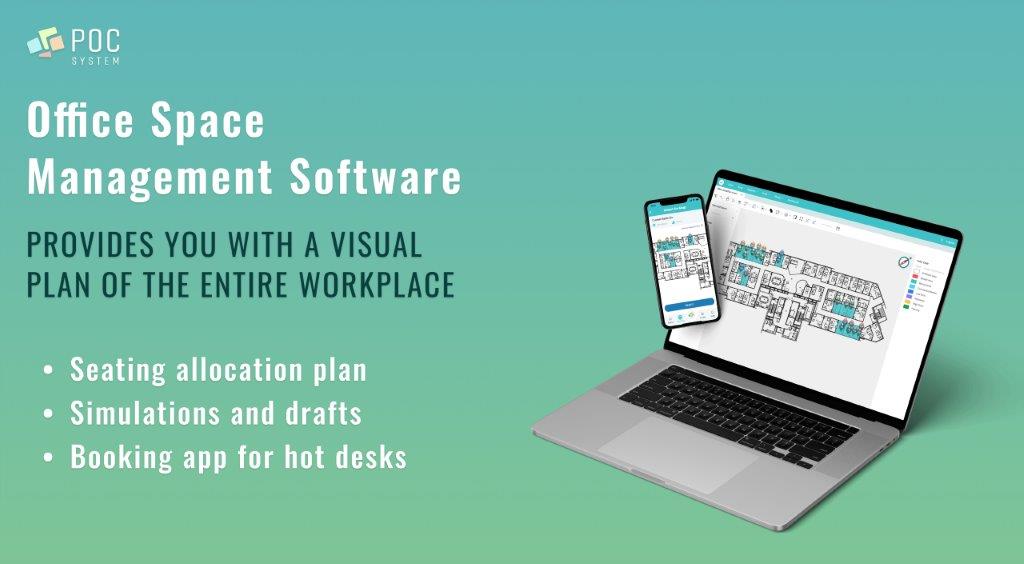
With POC's Space Management System, you can rely on powerful visual dashboards to monitor the situation in your office and enjoy the benefits of streamlined office space management. By letting you create and run simulations to get valuable insights on space utilization aspects like office space per employee, the software facilitates tracking and analyzing office metrics, leading to a better end result for your business.
Related Articles
Related Posts
Filip Dimkovski
How to Measure Density for Better Space Utilization
Filip Dimkovski
Create a Good Facility Management Report in No Time
Filip Dimkovski
